
Hope you all had a Happy Thanksgiving. In this final blog of the series I am going to cover aspects such as evaluating the key integration projects based on complexity, cost, benefits, and risks to prioritize the integration efforts to deliver the most benefit while minimizing risk, complexity, and cost.
Analyze Project Integrations against Business Benefits, Complexity, and Cost Criteria
Once the patterns have been selected for each integration requirement, it is possible to analyze and evaluate the integrations based on complexity, costs, and benefit. Again I liked to do this in a workshop environment where the relevant stakeholders and subject matter experts are present to give their input.
A concise set of criteria should be utilized to determine the relative complexity, costs, and benefits for each integration. Here are a sample of the criteria that I use.
Benefits Criteria
- New Revenues
- Cost Savings
- Product Innovation Gains
- Business Agility Gains
- Customer Satisfaction Gains
- M&A Flexibility
- Compliance Gains
- Reuse Value
Complexity Criteria
- Source Connectivity
- Target Connectivity
- Data Transformations
- Integration Flows
- Skill Set Availability
- Service Level Requirements
- Security Constraints
- Regulatory Constraints
- Caching Requirements
Costs Criteria
- Number of Message Types
- Number of Message Routes
- Number of Products
- Number of Cloud Services
- Message Volume
- Message Size
- Development Style
- Project Impact
- Operational Costs
Before using this criteria for scoring I like to confirm with the enterprise whether there is any weighting that should be taken into consideration. This enables a flexible approach that can be aligned with any Business/IT initiative.
The results of the complexity, costs, and benefits evaluation can be graphed in many forms. This assists with the analysis. For example this graph illustrates the analysis of the individual integrations against the complexity, cost and business benefit of each.

This graph measures the complexity on the horizontal axis, the cost on the vertical axis, and the benefit is represented by the size of the bubble. Therefore, a large bubble in the upper right corner would be the ideal integration i.e. low complexity, low cost, with high benefit.
Understand Integration Risks
While a little more challenging in an agile environment I also like to capture the risks associated with the integrations and evaluate this using a GUT approach (Gravity, Urgency, Trend).
- Gravity – Measures How Severe are the Consequences of the Risk
- Urgency – Measures How Soon the Risk will Manifest
- Trend – Measures How Much Worse the Risk will get with Time
In addition I like to identify the scope of the risk:
- Enterprise Risk – Applies to all Projects Equally (e.g. skills, resources)
- Project Risk – Applies to all Integrations for a Specific Project (e.g. partner system)
- Integration Risk – Applies to a Single Integration (e.g. security constraints)
If there is a risk mitigation strategy in-place to address specific risks then I usually make note of it and apply the risk as neutral.
The results of the integration risk analysis can be graphed in many forms. For example this first graph illustrates the risk associated with each integration – a larger value means the integration has more risk.
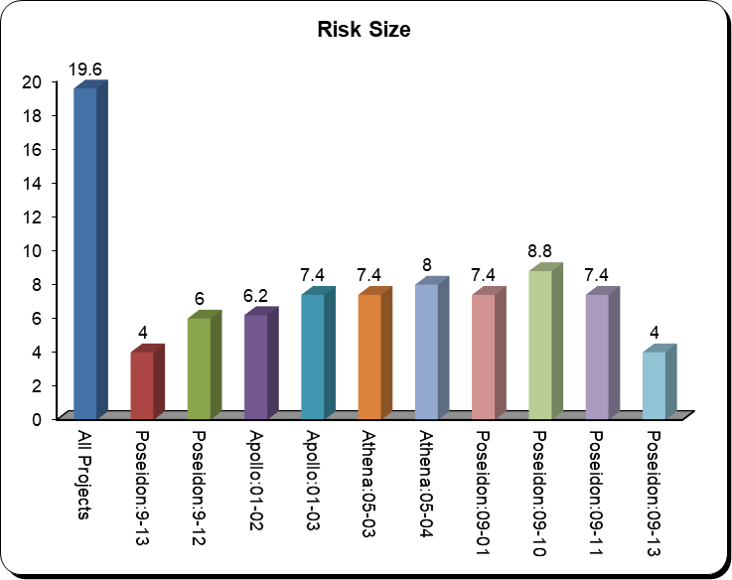
While the following graph illustrates the ratio of the benefit relative to the risk for each integration – a large value means the benefit delivered by the integration is large compared to the risks.

Understand Project and Integrations Dependencies
If each integration was independent from all other integrations, then the complexity, costs, and benefits analysis along with the risk analysis would provide all the information needed to prioritize the integrations. However, there are frequently dependencies between individual integrations that must be considered when developing a plan for implementing the integrations
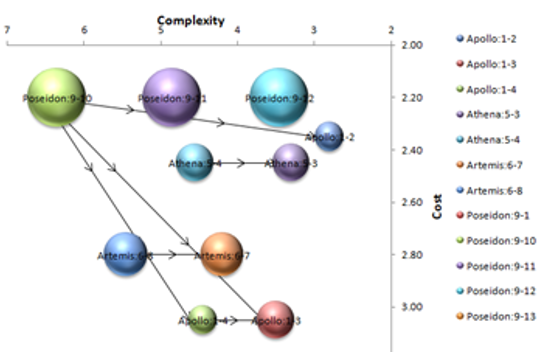
The above graph illustrates the dependencies via a line with an arrow depicting the dependency of one integration on another integration. For example the Poseidon:9-10 integration (top left green bubble) has dependencies on three other integrations.
Phasing
Putting together all of the analysis for complexity, costs, benefits, risks, and dependencies allows for the prioritization and ordering of the integrations to create a high-level, phased approach to implementing the integrations.
Again, using a simple whiteboard, sticky notes, and marker pens I collaborate with enterprises to define the business benefits of each phase and the mapping of the integrations to the appropriate phases.
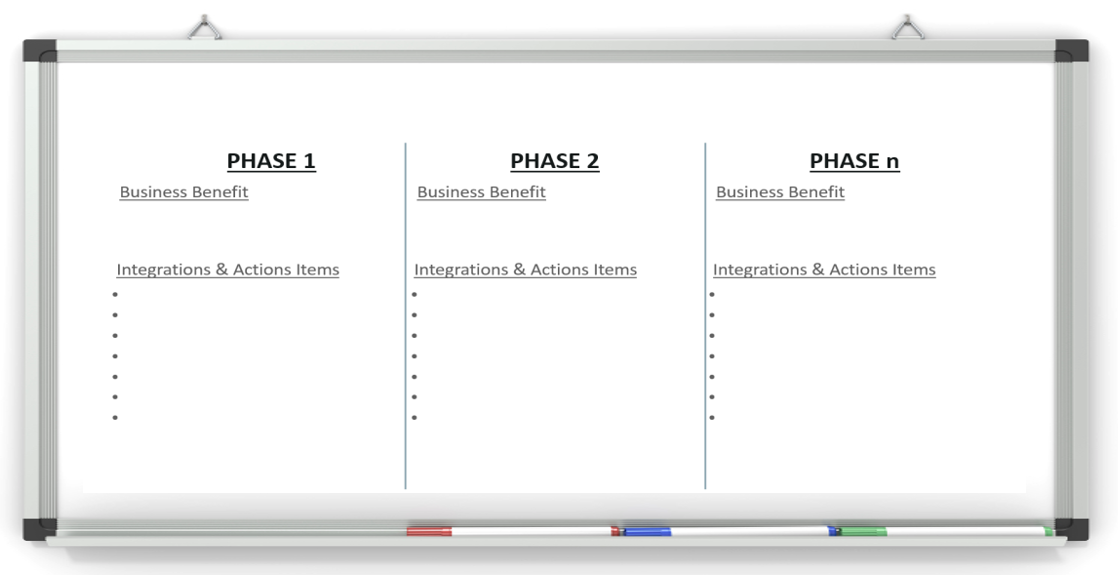
Each of the integrations should be ordered based on dependencies and based on delivering the most benefit with the lowest complexity, cost, and risk. Additionally, because the patterns for each integration have been selected, the cloud services and on-premises products needed to implement the integrations in each phase are known and can be shown as well.
Wrap-Up
So that brings me to the end of this series of blogs with regards to integrating in a hybrid and multi cloud environment. I think my next series will focus on developing in a hybrid cloud environment.
Good Luck, Now Go Architect….

Great blog post! I thoroughly enjoyed reading your insights on the agile approach to hybrid and multi-cloud integration. Your explanations were clear and concise, making it easy to understand the concepts involved. I appreciate how you highlighted the benefits of adopting an agile methodology in cloud integration projects and the importance of flexibility in today’s rapidly evolving technology landscape.
Your practical tips and best practices are invaluable for those navigating the complexities of hybrid and multi-cloud environments. I particularly liked your emphasis on collaboration and continuous feedback loops, as they foster effective teamwork and ensure that integration efforts align with business goals.
Overall, your blog series has been informative and enlightening. Thank you for sharing your expertise and providing guidance on how organizations can successfully implement an agile approach to hybrid and multi-cloud integration. I look forward to reading more of your content in the future. Keep up the great work!
LikeLike