
In order to gauge the return on investment for the reuse of Services and other assets, an organization must assess the potential value of key assets within its portfolio, continuously measure the impact of reuse on development productivity, and determine the ultimate impact on its bottom line.
IT organizations have at their disposal software assets that, if systematically reused in the transformation to a SOA, can lead to substantial savings each year by increasing development productivity and decreasing software maintenance costs.
The resulting performance improvements can have a significant impact on business agility and the ability to respond quickly to competitive challenges.
I am going to cover a simple approach for estimating the value of the various software assets contained in a typical portfolio. It should be noted that I describe an asset valuation process that focuses primarily on development savings. A comprehensive asset valuation process should also consider the operational aspects as well as the business savings and opportunities garnered from SOA.
The asset valuation process should expand incrementally, beginning with the simpler tasks: those assets that are of the most obvious relevance and value to the SOA. For example, common security components or customer information services may already be in use across multiple applications and projects. The asset valuation process should start with these Services and then expand to encompass other assets, providing an increasingly comprehensive and accurate picture of the asset portfolio’s overall value.
The process and calculations described in this blog distill years of experience with enterprises as well as recognized industry best practices. They were designed to estimate the potential reuse value of each asset and to project the expected return on investment (ROI) on an asset portfolio.
Estimate Value of Assets
A reusable asset can be defined as any artifact of the software development or SOA lifecycle, including but not limited to: Services (Web services, data services, etc.), business processes, architecture models, applications, frameworks, components, quite literally any code, metadata, or supporting artifact that is relevant to the SOA. If it has value, that value can be extended through reuse and that reuse value should be tracked and measured.
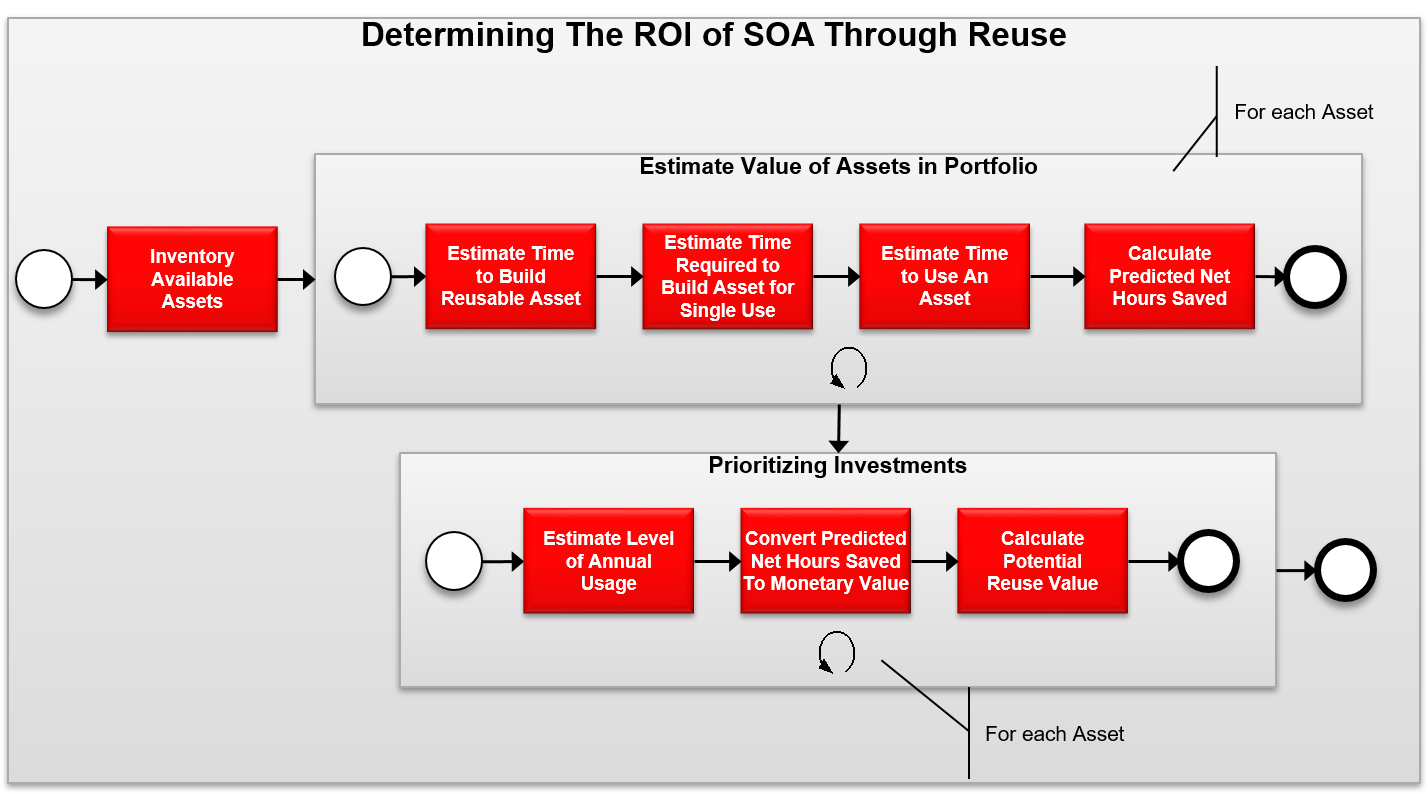
Within the confines of this focused approach, an asset’s estimated value is based on the development costs avoided by reusing rather than recreating it. That measurement is referred to here as Predicted Net Hours Saved. By reusing existing assets, an organization avoids both the costs of repeatedly developing the same functionality and the costs of maintaining different implementations of the same functionality. The more that reuse occurs, the greater the savings. The formula used to calculate avoided costs is simple and straightforward. The first part of the equation estimates the amount of time a developer would spend creating the asset for a single use. Next, the formula deducts the time spent to reuse an existing asset on a project. The result is an estimate of the net hours saved by reusing it.
Predicted Net Hours Saved by the Consumer = Estimated Time Required to Build an Asset for Single Use MINUS Estimated Time Required to Use an Existing Asset.
The formula then considers the level of annual usage for each asset and converts the total predicted net hours saved to a monetary value. The result is an estimate of the potential value of existing assets in the organization’s portfolio.
Inventory of Available Assets
You will need to inventory and organize available assets that will support the transition to SOA. Given the sheer volume of assets that may be available for reuse, the inventory process should proceed incrementally, identifying and categorizing key assets. Those that are in the greatest demand and are the most frequently used. Later you can expand to encompass other assets, as resources allow.
I like to categorize assets into the following 3 buckets:
- Services – Services and other assets exposed through contracts & interfaces typically have higher production and overhead costs. For example, it takes time to gather and generalize requirements, parameterize the interface, and test under a broad spectrum of use cases. However, Services and similar assets also offer the most significant overall reuse savings. Developers can easily access and understand a Service’s contract and interface and test its functionality, avoiding much of the design, development, and testing necessary for other types of assets. In addition, because there is a single implementation of the Service’s functionality, ongoing maintenance costs are greatly reduced
- Black-box code assets – The term black-box indicates that an asset’s code implementation is hidden from the end-user. Unlike Services, which typically have one deployed instance that is called by multiple users, black-box assets are incorporated into the developer’s code base, resulting in multiple deployed instances. Rate calculators and security frameworks are typical examples of black-box assets, which are distributed as binaries or as obfuscated objects. Clearly defined and documented interfaces serve as the communication channel between the asset and its surrounding environment. While the production and overhead costs for developing black-box assets are similar to those for Services, any reuse savings are reduced by testing and maintenance costs incurred when the black-box asset is incorporated into the consuming developer’s code base.
- White-box code assets – The term white-box is used to indicate that the code implementation of an asset is visible to end-users and that the source code can be modified when it is incorporated into the developer’s code base. Open-source assets, such as Struts, are white-box by definition. White-box assets offer the lowest level of return in a reuse program. While they can improve development productivity, their value in terms of maintenance savings is limited because their use can result in the deployment of multiple variations of an asset, each of which must be individually supported. If a mandatory change occurs to the core functionality of a white-box asset, each deployed variation will have to be examined, modified, and retested.
While black-box and white-box assets have traditional been aligned with component based reuse, there is still value is considering the reuse of these asset types in an SOA environment due to their predicted use by Services themselves.
Estimate Time To Build Reusable Asset
For each reusable asset you will need to capture the time invested in producing this asset and any supporting artifacts. This effort should reflect the total development effort. For example here is the time invested in producing a reusable security service,
| Service Analysis | Estimated Hours |
| SOA Requirements | 120 Hours |
| Service Identification & Analysis | 8 Hours |
| Service Release Planning | 40 Hours |
| Service Delivery | |
| Service Definition | 24 Hours |
| Service Design | 80 Hours |
| Service Implementation | 80 Hours |
| Service Test | 120 Hours |
| Total | 472 Hours |
I have seen reuse value accumulate quickly, especially in a well-managed reuse environment. So in keeping with the idea that the asset valuation process should start small, with the low-hanging fruit, even a conservative, “good enough” estimate of the time invested in producing a reusable asset can result in compelling evidence of the value of reuse.
Estimate Time Required To Build Asset for Single Use
Building and/or harvesting a Service or other reusable asset typically takes more time and effort than building an asset for single use. This extra time and effort is called the Production Investment and it includes the time and effort involved in the development, packaging, and documentation necessary to enhance an asset’s reusability and availability across the widest possible audience. For example, a developer might invest 540 hours creating a function for use on a project. An organization will spend approximately twice the amount of time-200%-building a reusable Service.
Compiled from industry best practices here are some example production investment for each category that I mentioned earlier.
| Asset | Production Investment |
| Services | 200% |
| Black-Box Assets | 200% |
| White-Box Code Assets | Asset |
The reuse savings estimate for each asset is based on the time that a developer would have spent developing equivalent functionality for a single use. For example, the 472 hours to produce the reusable Service I mentioned earlier. If the average production investment for a reusable Service is 200 percent (that is, twice the time it takes to build the equivalent functionality in a single-use asset), a developer would have spent 236 hours building a single-use version of the Service. That figure (236 hours) provides the basis for calculating the estimated reuse savings for the Service.null
The values above are provided as a baseline. Few organizations actually measure the Production Investment associated with the reusable assets in their portfolios until they have established a managed reuse program. The next step is to calculate and subtract the Consumption Factor, the time that a developer will spend reusing the asset.
Estimate Time To Use An Asset
Reuse is not free. It takes time to evaluate and then reuse an asset in a project. This time is estimated using the Consumption Factor. Here are some example Consumption Factors associated with various asset categories.
| Asset | Consumption Factor |
| Services | 5% |
| Black-Box Assets | 20% |
| Domain-specific black-box assets | 5% |
| White-Box Assets | 40% (<25% code modifications) |
| White-Box Assets | 90% (>25% code modifications) |
As previously discussed, a developer would have spent 236 hours building a
single-use version of the Service in my example. The consumption factor for Services is 5 percent. (In this context, consumption refers to the design-time incorporation of a Service call in the development of an application.) Applying this consumption factor to the previously determined 236 hours figure produces an estimate of 12 hours to reuse the service.
As with the Production Investment values described, Consumption Factor values are provided only as a baseline and you should adjust to reflect your experience.
Predicted Net Hours Saved
The difference between the time a developer would spend building an asset for single use and the time needed to use a reusable version of that asset is referred to as Predicted Net Hours Saved. This represents the development cost avoided through reuse of the asset.
The Service in my example would have taken about 236 hours to develop for single use. Based on the calculations described above, a developer will take an estimated 27 hours to reuse the security Service. The difference is the Predicted Net Hours Saved value for the Service.
Estimate Level of Annual Usage
In any given year, most organizations have a number of development projects in their pipeline. It is likely, however, that only a subset of these projects will actually have an opportunity to reuse assets in their portfolio. For example, of the 100 projects an organization may have funded for next year, 25 percent may be impractical for reuse. In my example lets presume that the potential for asset reuse is possible and appropriate in only 75 projects (100 minus 25 percent).
The next step is to estimate how many times each asset will be reused. It is unlikely that every project with access to the asset portfolio will leverage every available asset. For example, perhaps only one-third of the projects that represent opportunities for reuse will be able to reuse the example service. This translates to 25 annual reuse opportunities (one-third of 75).
That will do for now.
Good Luck, Now Go Architect Reuse That Asset…
